Peek GIS Diagram
Introducing the Peek GIS Diagram. A fresh, modern GIS diagram viewer using the latest technologies, designed for power utilities critical use, in the field or in the office.


Web or App
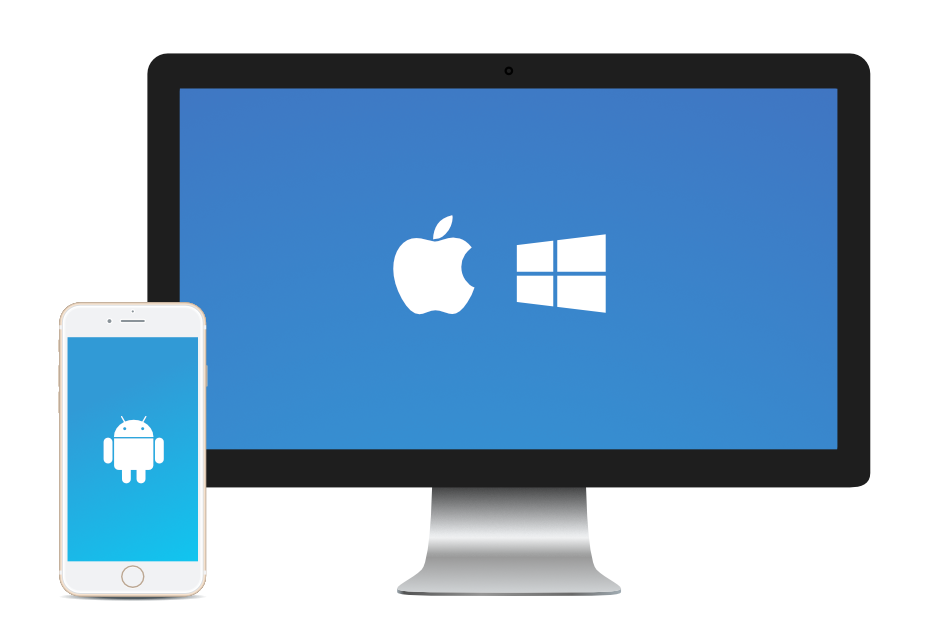
The Peek GIS Diagram is a Web App and a Native App. The Web App runs on desktop browsers and supports full touch gestures on mobile devices. The native apps are available for iOS, Android and Windows mobile devices, and Windows or macOS for desktops.

No Limits
The GIS Diagram runs on top of the Peek open source, pluggable enterprise platform. This platform is designed from the ground up to give utilities the option of writing custom plugins and extend functionality. Fully document online at http://synerty-peek.readthedocs.io. The GIS Diagram plugin provides APIs for loading and positioning the diagram, custom toolbar buttons, custom device popup buttons, and custom device popup details.


Go Offline
The Peek GIS Diagram locally caches data when browsing around the network, and the option to fully cache the whole diagram. Providing the whole diagram offline in remote areas with no connectivity.
Highly Compressed Grids
The Peek GIS Diagram recompiles loaded raw display data into highly compressed data grids. A “Z” layer of grids changing in size depending on the zoom level, provides performance when the user zooms out to see the entire network. Display items too small to see are automatically filtered out, and all this is customisable.


Search
(Coming Soon) A Peek universal search plugin allows users to search for streets or equipment based on partial keywords such as part of the name or equipment id. Like all Peek Plugins, the search plugin has an API, allowing more possibilities such as locating equipment in an incident.
Overlays
The Peek GIS Diagram can have data from any number of sources loaded into it. Load in as many sets of data as needed, vehicle tracking, lightning strikes, bush fires, road detours from government sources, or more.


Mockup Edit Support
(Coming Soon) The Peek GIS Diagram supports diagram mockups, the diagram can be temporarily edited. The edit can then be sent as an image, integrated with other plugins allowing field users to propose updates to the GIS team or include with DNARs, etc.

